One demanding reference WAV · DeltaWave residual metrics
Which compile measures closest to the original WAV?
This page compares each encoded output against the same original WAV. The source is deliberately difficult and artifact-prone, so it is useful for exposing measurable encoder behaviour. The goal here is compile/configuration closeness to the reference, not bitrate, speed, or file-size ranking.
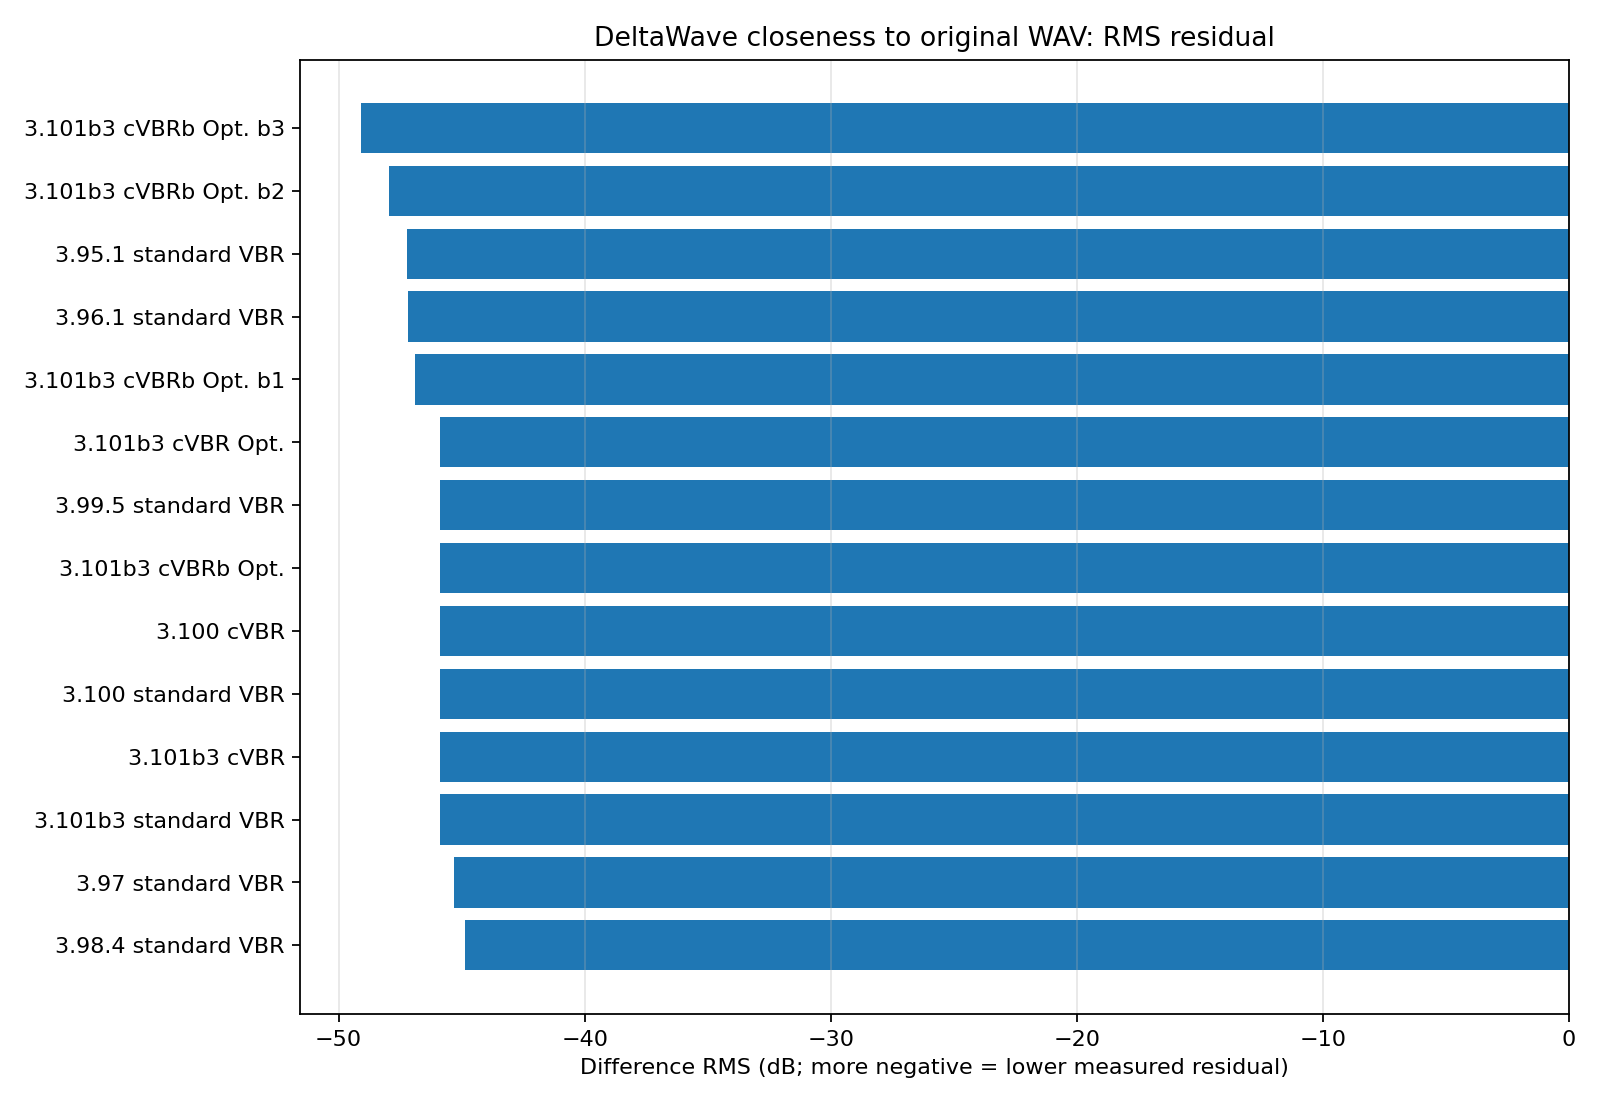
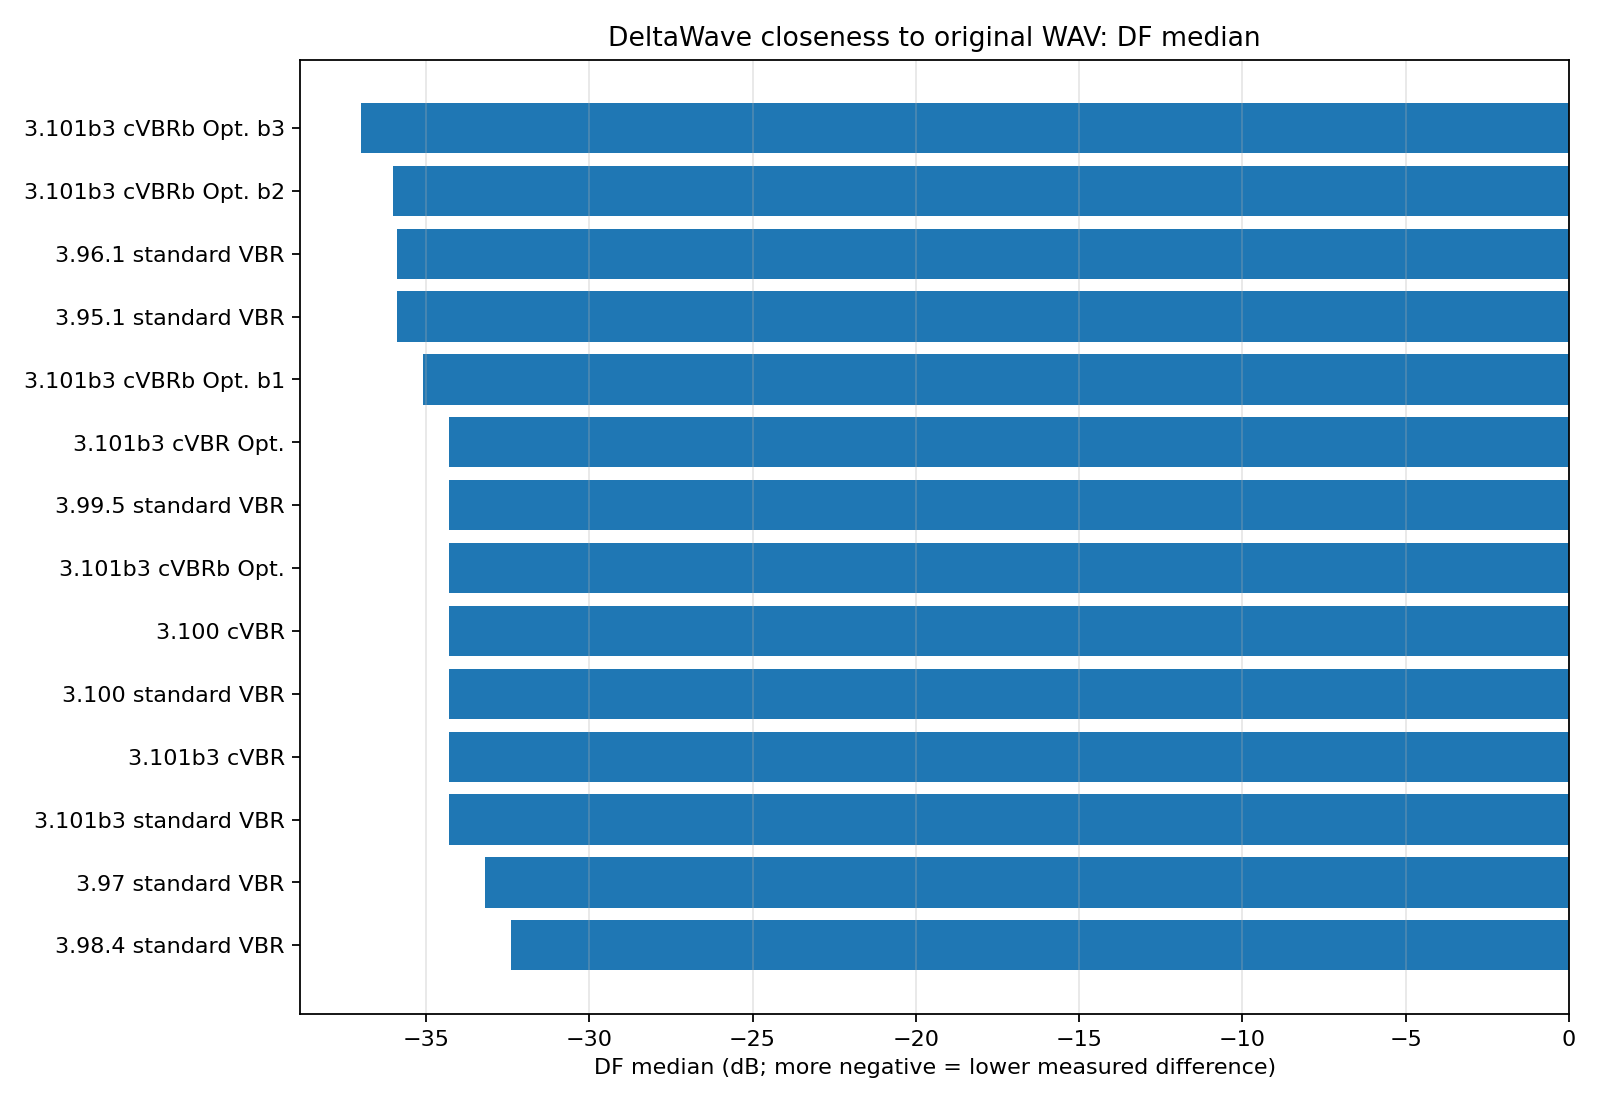
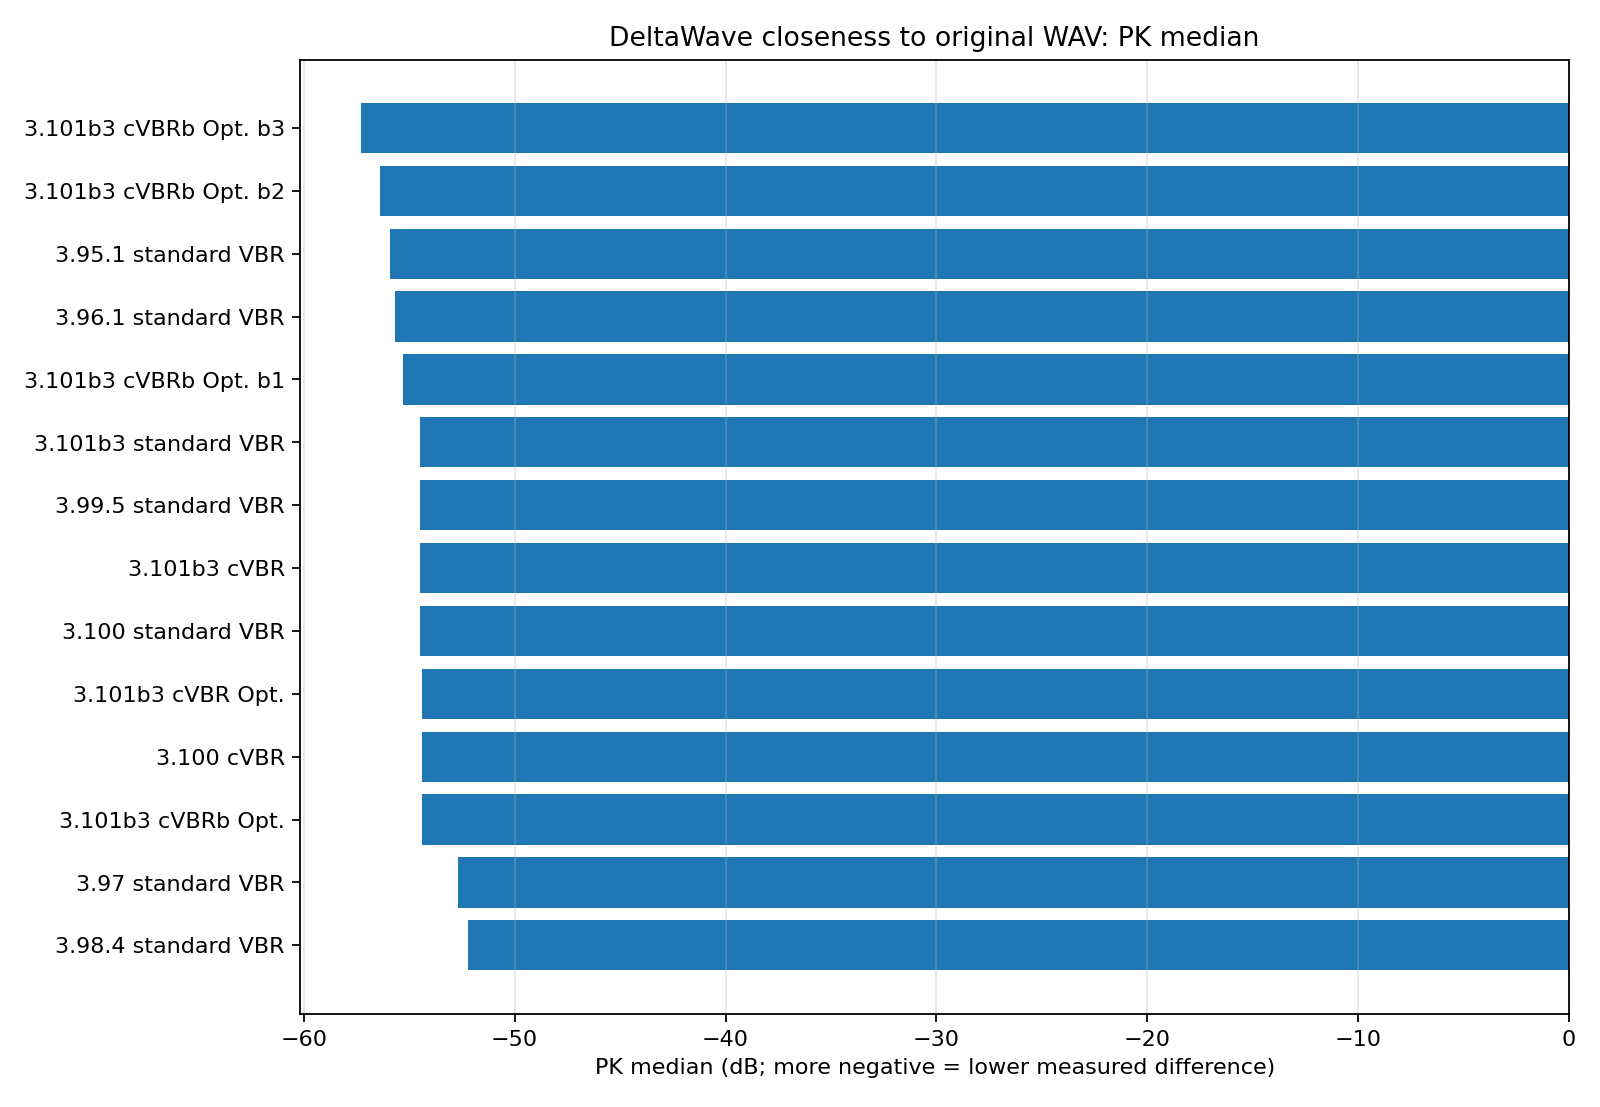
3.101b3 cVBRb Optimized boost 3 measures closest by Difference RMS, DF median, and PK median in this dataset.
Some early builds also produce low residuals, but the DeltaWave images show floor/filtering behaviour that should be considered before treating those rows as simple wins.
This is not a listening test. It is a technical signal comparison against a reference WAV.
Metrics used
Difference RMSRMS level of the aligned residual. More negative means lower measured residual against the reference.
DF median and PK medianComplementary DeltaWave difference metrics. More negative values are treated as lower measured difference in this analysis.
Null depthA useful diagnostic, but not used as the only ranking measure because alignment and spectral behaviour can influence it.
Difference RMS against the reference WAV
This is the main closeness chart. It deliberately excludes speed, bitrate, and file size.
Difference RMS against the original WAV.
How to read it: more negative is closer to the reference WAV. Less negative means a larger measured residual. This is not an audible-quality verdict.
Cross-check metrics
DF median gives a second view of measured difference. It broadly agrees with the RMS residual ranking for the closest rows.
How to read it: more negative DF values mean lower measured difference in this analysis.
PK median is included as a further residual-style cross-check, not as a standalone quality score.
How to read it: more negative PK values mean lower measured difference in this analysis.
Reference-closeness table
The mean residual rank is a simple average of the Difference RMS, DF median, and PK median ranks. It is included to make the table easier to scan, not to declare a universal winner.
Compile / configuration
Difference RMS
DF median
PK median
Mean residual rank
Diagnostic note
3.101b3 cVBRb Optimized boost 3
-49.10 dB
-37.0 dB
-57.3 dB
1.00
3.101b3 cVBRb Optimized boost 2
-47.97 dB
-36.0 dB
-56.4 dB
2.00
3.95.1 standard VBR
-47.22 dB
-35.9 dB
-55.9 dB
3.00
Filtered/floor visible
3.96.1 standard VBR
-47.17 dB
-35.9 dB
-55.7 dB
3.67
Filtered/floor visible
3.101b3 cVBRb Optimized boost 1
-46.90 dB
-35.1 dB
-55.3 dB
5.00
3.100 standard VBR
-45.90 dB
-34.3 dB
-54.5 dB
6.00
3.101b3 cVBR
-45.90 dB
-34.3 dB
-54.5 dB
6.00
3.101b3 standard VBR
-45.90 dB
-34.3 dB
-54.5 dB
6.00
3.99.5 standard VBR
-45.90 dB
-34.3 dB
-54.5 dB
6.00
3.100 cVBR
-45.90 dB
-34.3 dB
-54.4 dB
7.33
3.101b3 cVBR Optimized
-45.90 dB
-34.3 dB
-54.4 dB
7.33
3.101b3 cVBRb Optimized
-45.90 dB
-34.3 dB
-54.4 dB
7.33
3.97 standard VBR
-45.33 dB
-33.2 dB
-52.7 dB
13.00
Filtered/floor visible
3.98.4 standard VBR
-44.88 dB
-32.4 dB
-52.2 dB
14.00
Filtered/floor visible
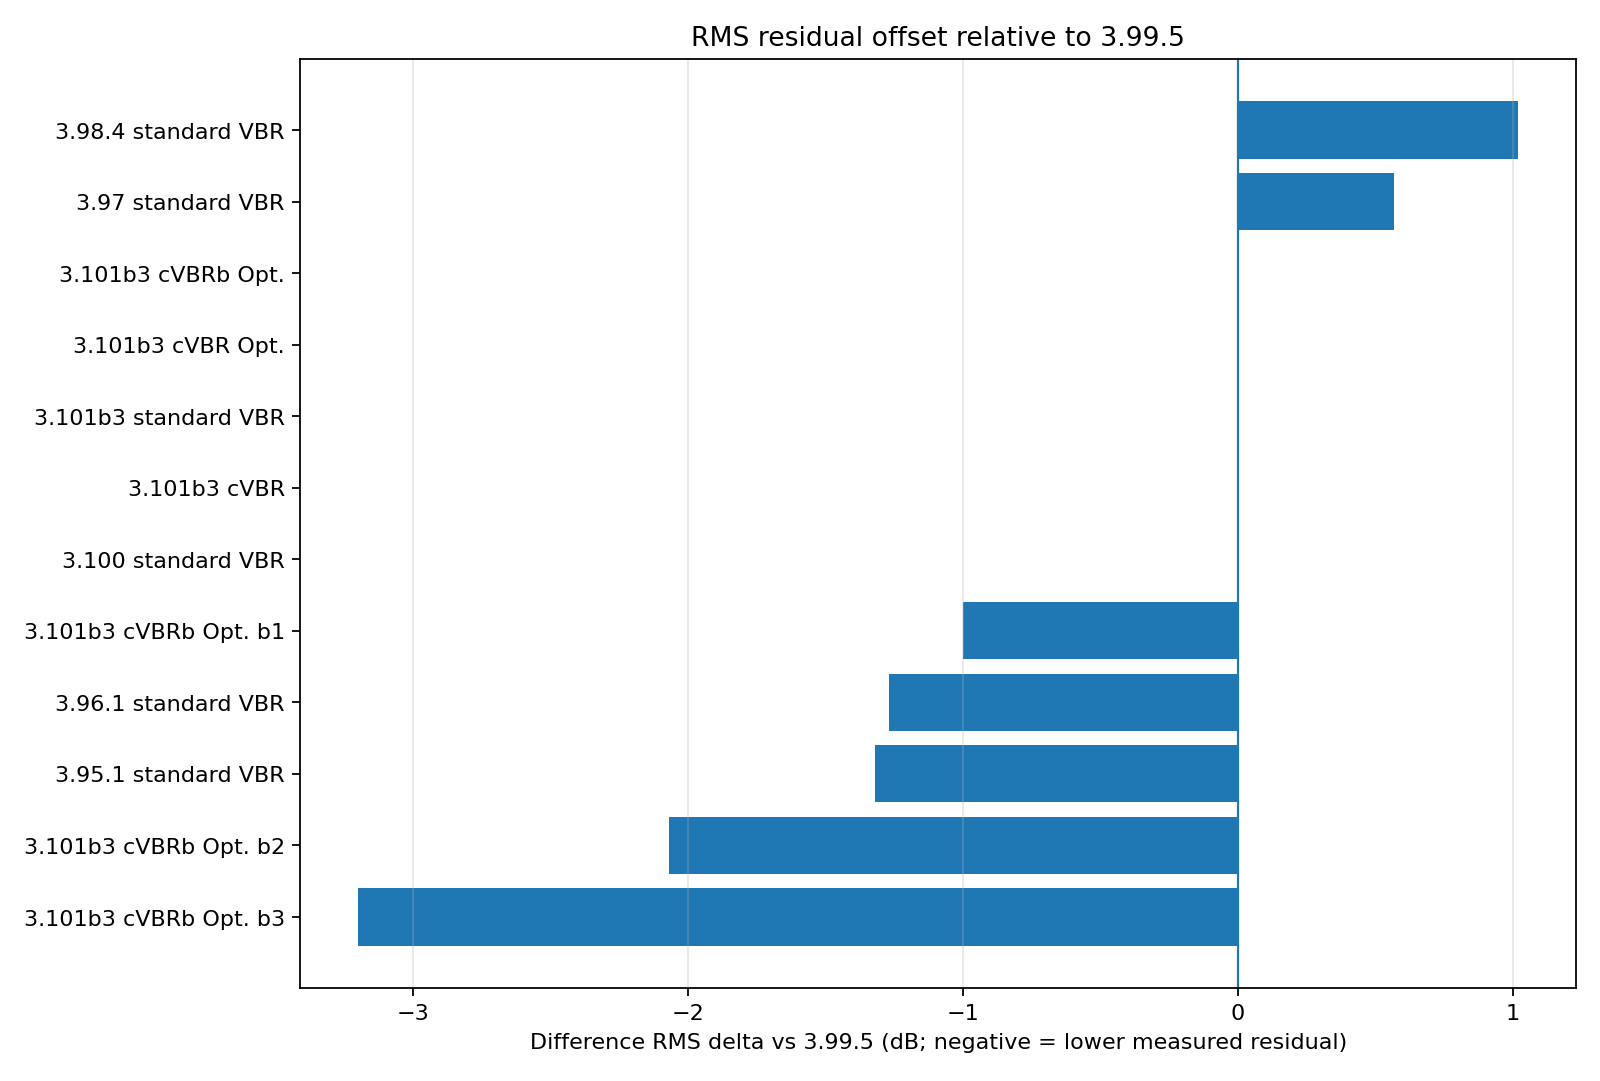
Offset from 3.99.5
This centered view is useful because many modern rows cluster closely. Negative values mean lower measured RMS residual than 3.99.5 on the same reference sample.
Delta from 3.99.5 using Difference RMS only. It is a measured residual offset, not a quality verdict.
How to read it: negative bars are closer than 3.99.5 by this RMS residual metric; positive bars are farther from 3.99.5.
Limitations
This lab page uses one deliberately demanding reference WAV. That makes it useful as a stress case, but it is not a broad multi-track listening study. It also does not include ABX results or listener preference data.
Some earlier builds show visible floor/filtering behaviour in the report images. Those floors matter because they can reduce high-frequency detail while also changing residual metrics. The frequency-range lab looks at that separately.
FAQ
What does a more negative value mean here?
For Difference RMS, DF median, and PK median, more negative means a lower measured residual against the original WAV. In this page, that is treated as closer to the reference.
Does closest mean best sounding?
No. These are DeltaWave technical measurements against one demanding reference sample, not ABX listening tests or listener-preference results.
Why mark some early builds as filtered?
Some embedded DeltaWave report images show visible filtering or floor behaviour. The shorter note means those rows need that visual context when reading the numeric residuals.