This three-album comparison covers official releases from LAME 3.95.1 through 4.0. The current 4.0 cVBRb MinGW and Visual Studio builds were tested separately against the same sources and settings.
Three albums · five VBR settings · current and archived builds
A generational shift in the LAME VBR bitrate curve
This study compares official LAME releases from 3.95.1 through 4.0 across three complete albums using -V0 through -V4. It also compares the current 4.0 cVBRb MinGW and Visual Studio builds, showing both bitrate allocation and build-performance differences.
3.101, 4.0 and the current 4.0 cVBRb builds share effectively the same measured output curve. The two cVBRb builds differed by no more than a few bytes in the averaged results.
The curve changed after 3.98.4. The 3.99.5+ family spends more bits at -V0 and -V1, but is smaller than 3.98.4 at -V2.
Older encoders often make smaller files. That should be read as different tuning, not automatic proof of better quality.
What was tested
SourcesThree complete albums, used as varied real-world material rather than short synthetic samples.
Settings-V0, -V1, -V2, -V3 and -V4.
Build controlAll binaries in this comparison were compiled with MinGW on the same machine, keeping the build environment as consistent as practical across the archived official releases.
MeasuredFinal output size, elapsed encode time, and MiB per second from the benchmark batch output.
InterpretationFile size is treated as evidence of bitrate allocation behaviour, not as proof of audible quality.
Average output size across three albums
Lower numbers mean smaller files. The chart gives the clearest visual overview of the curve, while the table below provides the exact MiB values for each archived official release.
Average output size across the three-album test set. The shared 4.0 cVBRb line represents both current toolchains because their output sizes were effectively identical.
The cVBRb MinGW and Visual Studio size curves are effectively identical, so they are represented by one shared cVBRb curve. Their separate encoding times are shown below.
Version / build
Toolchain
-V0
-V1
-V2
-V3
-V4
3.95.1
Official MinGW x64
97.877 MiB
87.750 MiB
77.779 MiB
70.725 MiB
67.205 MiB
3.96.1
Official MinGW x64
97.196 MiB
87.304 MiB
77.511 MiB
70.475 MiB
67.114 MiB
3.97
Official MinGW x64
99.120 MiB
89.756 MiB
79.183 MiB
66.998 MiB
60.677 MiB
3.98.4
Official MinGW x64
98.766 MiB
87.681 MiB
79.703 MiB
66.931 MiB
61.273 MiB
3.99.5
Official MinGW x64
103.024 MiB
89.138 MiB
75.724 MiB
68.065 MiB
60.129 MiB
3.100
Official MinGW x64
103.024 MiB
89.138 MiB
75.724 MiB
68.065 MiB
60.129 MiB
3.101
Official MinGW x64
103.024 MiB
89.123 MiB
75.712 MiB
68.066 MiB
60.130 MiB
4.0
Official MinGW x64
103.024 MiB
89.123 MiB
75.712 MiB
68.066 MiB
60.130 MiB
4.0 cVBRb
MinGW / Visual Studio x64
103.024 MiB
89.123 MiB
75.712 MiB
68.066 MiB
60.130 MiB
Current 4.0 build performance
The cVBRb MinGW and Visual Studio builds produced effectively identical output sizes, but the Visual Studio build encoded consistently faster in this three-album suite.
Average elapsed time across the three albums. The Visual Studio cVBRb build was approximately 14–15% faster than the MinGW cVBRb build at every tested VBR setting.
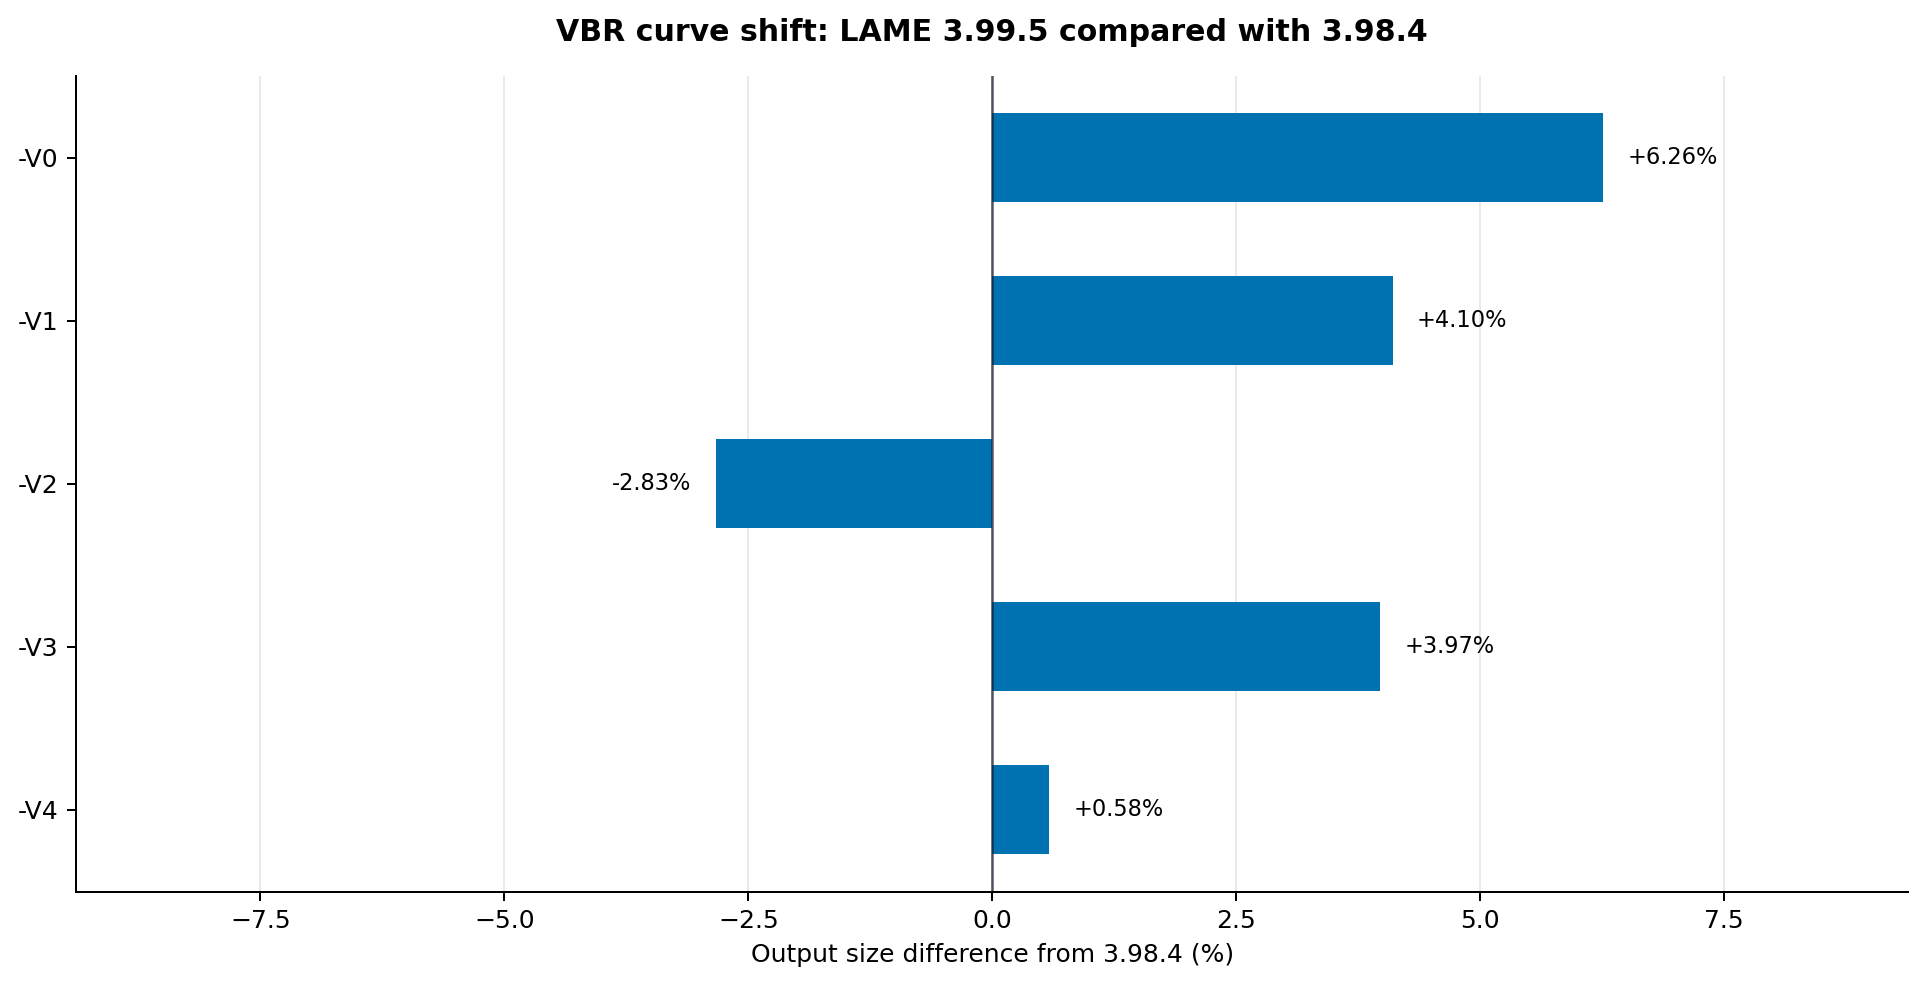
The 3.99.5 family is not simply larger or smaller. It redistributes bits across the quality scale, which is why a shift chart can be more revealing than the raw numbers alone.
Output-size change from 3.98.4 to 3.99.5 at each VBR setting. Positive values mean 3.99.5 produced larger files; negative values mean it produced smaller files.
Setting
3.98.4 avg size
3.99.5 avg size
Size difference
Speed difference
-V0
98.766 MiB
103.024 MiB
+4.31%
+2.95%
-V1
87.681 MiB
89.138 MiB
+1.66%
+4.02%
-V2
79.703 MiB
75.724 MiB
-4.99%
+5.79%
-V3
66.931 MiB
68.065 MiB
+1.69%
+4.65%
-V4
61.273 MiB
60.129 MiB
-1.87%
+5.27%
Centered curve summary
Smaller files do not automatically mean better quality, so this summary chart avoids a simple “winner” view. Instead, each version is mapped around a centered reference line. Negative values mean it tended to sit on the smaller-file side of the tested group, while positive values mean it tended to sit on the larger-file side.
Peak-mapped median offset across the tested VBR settings. This keeps every version represented while reflecting the general direction and magnitude of its file-size tendency. It is a comparative summary, not a quality verdict, and should be read as a companion to the actual curve graph rather than a replacement for it.
What this suggests
1. -V0 and -V1 became more conservative
The 3.99.5+ family spends noticeably more bits than 3.98.4 at the top of the VBR scale.
2. -V2 is the crossover point
At -V2, 3.99.5 becomes smaller than 3.98.4 on average while remaining slightly faster.
3. Older encoders use a different curve
3.96.1 and 3.97 often sit toward the smaller-file end of the group, especially on albums two and three, but that should be interpreted as different tuning rather than an automatic quality win.
4. Current cVBRb output matches official 4.0
The current MinGW and Visual Studio cVBRb builds produced effectively the same output sizes as official 4.0 at every tested VBR setting. Their main difference in this suite is encoding speed.
External context
LAME describes -V n as a VBR quality setting where 0 is highest quality and 9 is lowest. It also notes that VBR mode already uses the highest quality option internally, so extra -h or -v switches are not needed when using -V.
Hydrogenaudio's LAME knowledgebase frames LAME as a high-quality MP3 encoder at mid and high bitrates, with VBR settings such as -V0, -V1, -V2 and -V3 commonly used for high-quality encoding. These pages are included as background, not as a substitute for listening tests.