Updated ABR performance data
This page now uses the refreshed ABR 192 kbps test files. The updated set includes official 3.101 and 4.0 builds, plus current MinGW and Visual Studio cVBRb builds with separate ABR boost runs.
This page now uses the refreshed ABR 192 kbps test files. The updated set includes official 3.101 and 4.0 builds, plus current MinGW and Visual Studio cVBRb builds with separate ABR boost runs.
LAME 4.0 continues the 3.101 ABR output profile. The official 3.101 and 4.0 rows produce the same number of bytes as 3.99.5, while encoding faster in this spot check.
The 4.0 cVBRb Visual Studio ABR boost run is the fastest row here. It is about 17.8% faster than 3.99.5 by throughput, with a larger output file than the unboosted Visual Studio run.
3.100 again matches 3.99.5 output byte-for-byte. It is about 93.9% slower by elapsed time in this updated ABR 192 test.
These charts use LAME 3.99.5 as the baseline. A value of 1.0x means equal throughput; larger values mean faster encoding on the test system. Output-size differences are shown against the 3.99.5 output bytes.
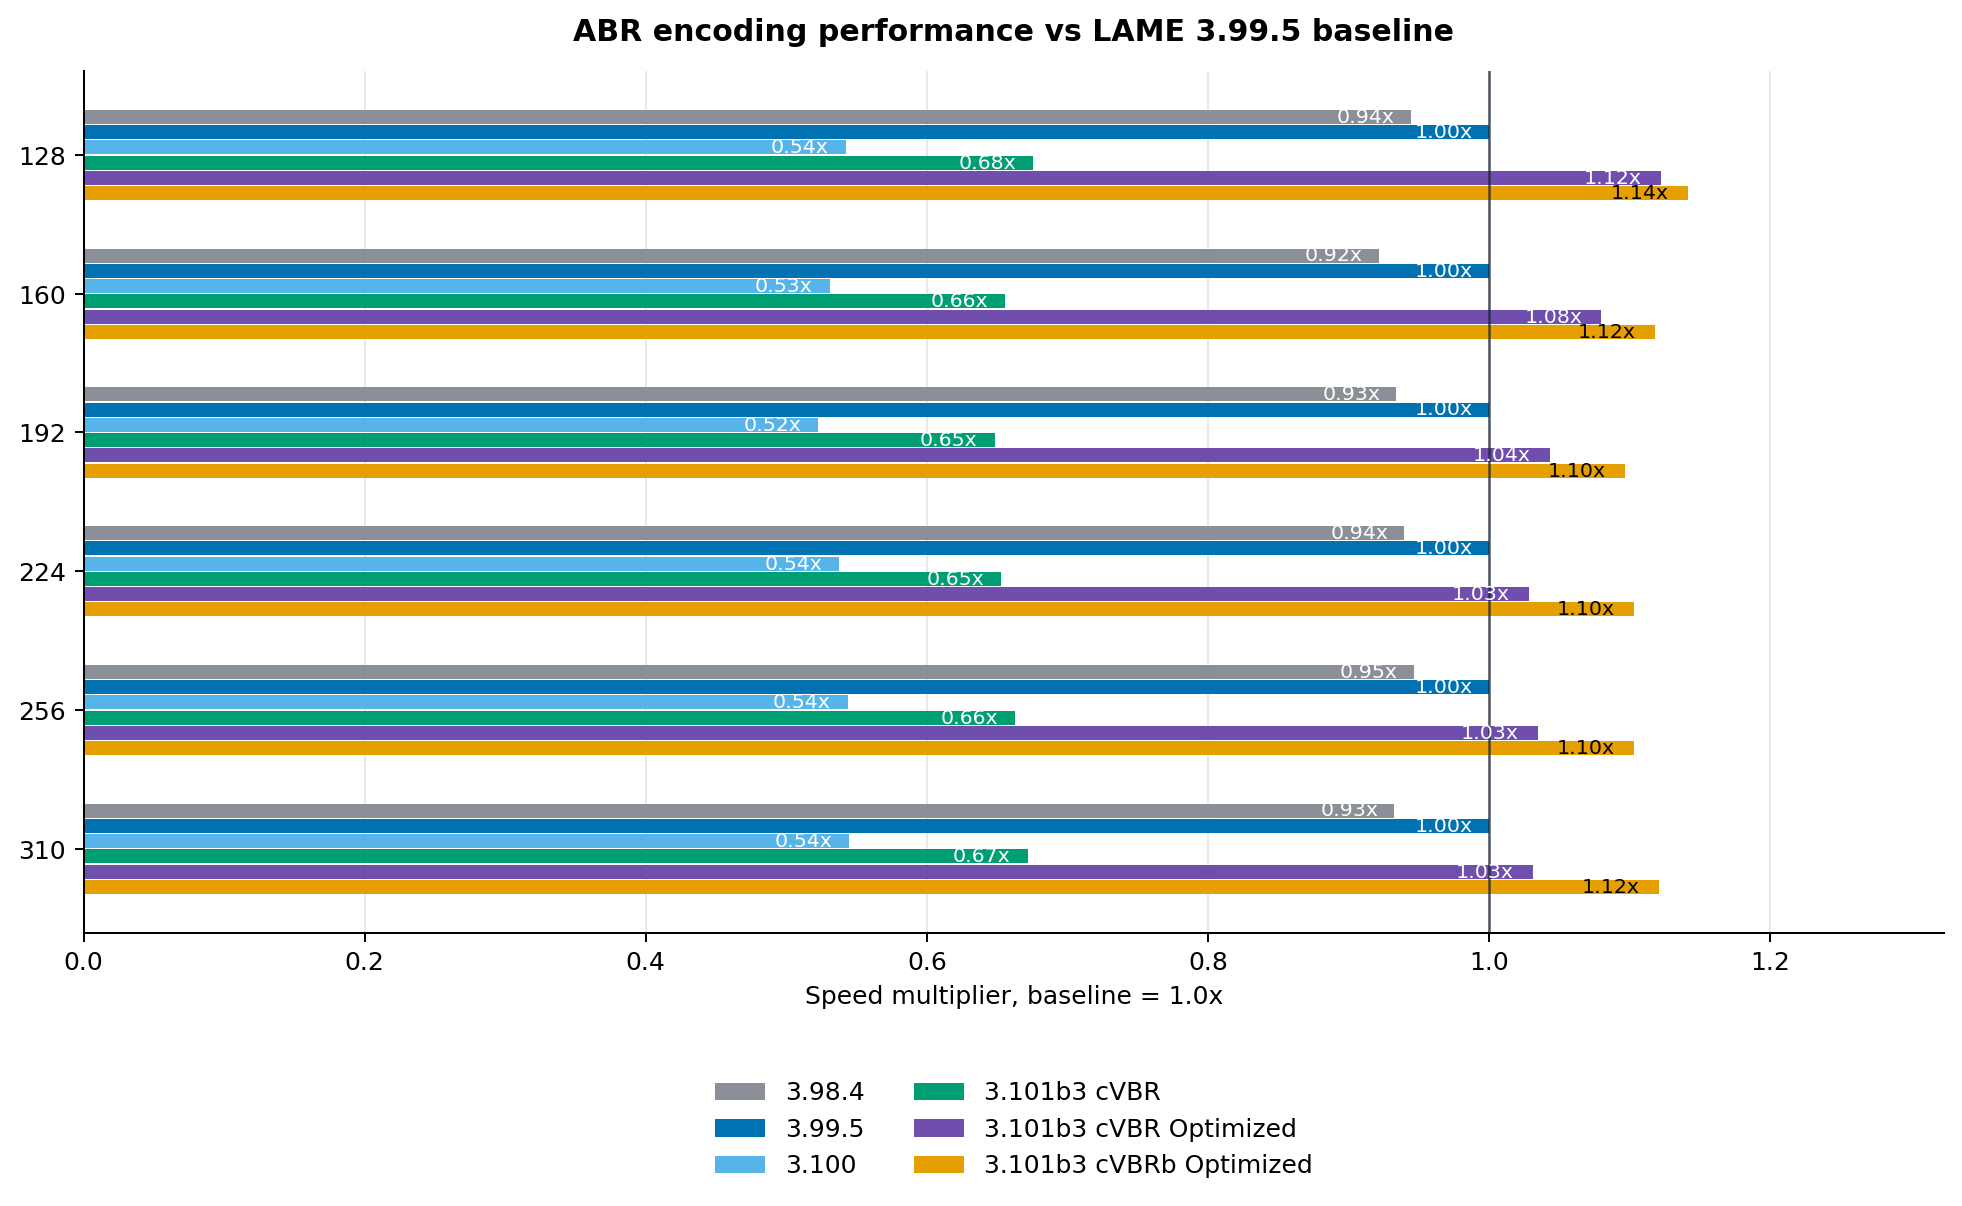
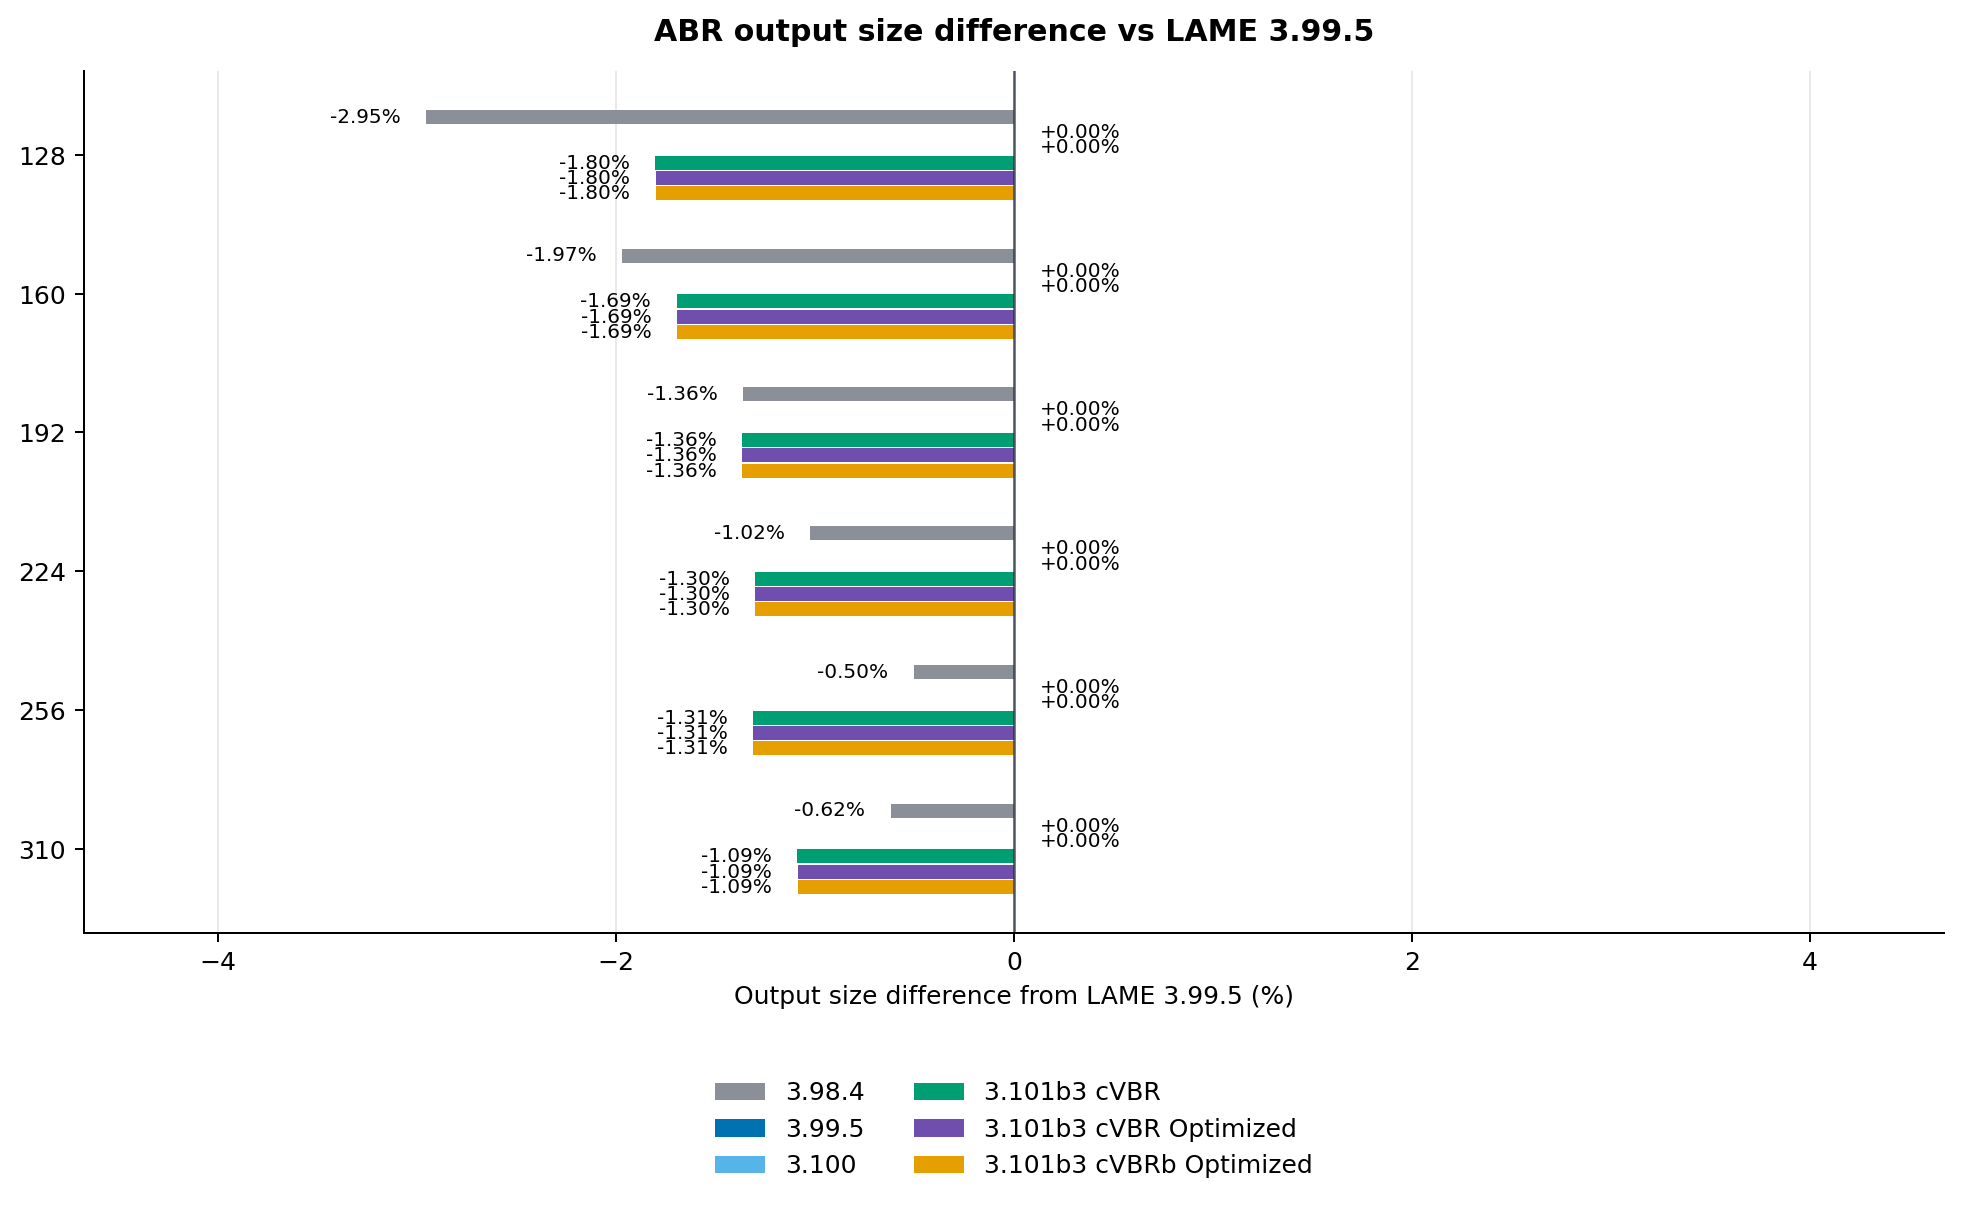
These charts compare output size and encoding throughput only. They do not claim audible quality differences.
ABR sits between CBR and quality-based VBR. It aims for a chosen average bitrate, but it can still use different frame sizes, which made it useful when final file size mattered more than a pure quality target.
This refreshed test uses ABR 192 as a practical spot check because it is a common target for bitrate-budgeted music, movie audio, spoken word and compatibility-focused workflows.
Rows are ordered by release/history rather than by speed. Throughput is MiB per second from the uploaded ABR test CSVs.
| Version / build | Mode | Elapsed time | Throughput | Speed vs 3.99.5 | Output size | Size vs 3.99.5 |
|---|---|---|---|---|---|---|
| 3.95.1 | ABR | 8.47 s | 1.588 MiB/s | 0.76x | 13.454 MiB | +3.63% |
| 3.96.1 | ABR | 8.25 s | 1.617 MiB/s | 0.78x | 13.344 MiB | +2.78% |
| 3.97 | ABR | 8.66 s | 1.501 MiB/s | 0.74x | 12.995 MiB | +0.09% |
| 3.98.4 | ABR | 6.88 s | 1.889 MiB/s | 0.93x | 12.994 MiB | +0.09% |
| 3.99.5 | ABR | 6.42 s | 2.022 MiB/s | 1.00x | 12.982 MiB | +0.00% |
| 3.100 | ABR | 12.45 s | 1.043 MiB/s | 0.52x | 12.982 MiB | +0.00% |
| 3.101 | ABR | 5.77 s | 2.250 MiB/s | 1.11x | 12.982 MiB | +0.00% |
| 4.0 | ABR | 5.74 s | 2.262 MiB/s | 1.12x | 12.982 MiB | +0.00% |
| 4.0 cVBRb MinGW | ABR | 5.87 s | 2.212 MiB/s | 1.09x | 12.982 MiB | +0.00% |
| 4.0 cVBRb Visual Studio | ABR | 5.45 s | 2.382 MiB/s | 1.18x | 12.982 MiB | +0.00% |
| 4.0 cVBRb MinGW | ABR boost | 5.91 s | 2.257 MiB/s | 1.09x | 13.339 MiB | +2.74% |
| 4.0 cVBRb Visual Studio | ABR boost | 5.46 s | 2.443 MiB/s | 1.18x | 13.339 MiB | +2.74% |
The fastest row in this updated data is 4.0 cVBRb Visual Studio ABR at 5.45 seconds. It is about 17.8% faster than 3.99.5 by throughput.
Compared with the unboosted Visual Studio ABR row, ABR boost is about -0.2% faster by throughput and about 2.7% larger by output bytes in this sample.
As in the VBR performance study, 3.100 matches 3.99.5 byte-for-byte in this ABR 192 dataset but takes substantially longer to encode. That keeps the slowdown visible outside the VBR quality-curve path.
Unlike -V VBR, ABR is guided by a requested average bitrate. That makes it a useful independent performance check.
3.100 still matches 3.99.5 output while taking much longer, showing that the slowdown is not confined to the VBR quality curve.
The current Visual Studio rows lead this updated ABR 192 data. The result is presented as an end-to-end build comparison, not as attribution to one individual code change.
The ABR boost row is fastest in this run, but it also creates a larger file than the unboosted 4.0 cVBRb rows, which is consistent with the boost feature spending more bitrate.
LAME describes ABR as average-bitrate encoding, designed to target a chosen bitrate while retaining more flexibility than strict CBR. Hydrogenaudio similarly describes ABR as a variable-bitrate MP3 mode that targets a specified average bitrate.