Where do the builds appear to preserve high-frequency activity?
This page looks at visible frequency-range behaviour in the embedded DeltaWave report images. It is intended to sit beside the reference-closeness page, not replace listening tests or the main performance studies.
Encoding speed is deliberately left out here. Performance is covered elsewhere on the site; this lab page focuses on measured output behaviour against the demanding reference WAV.
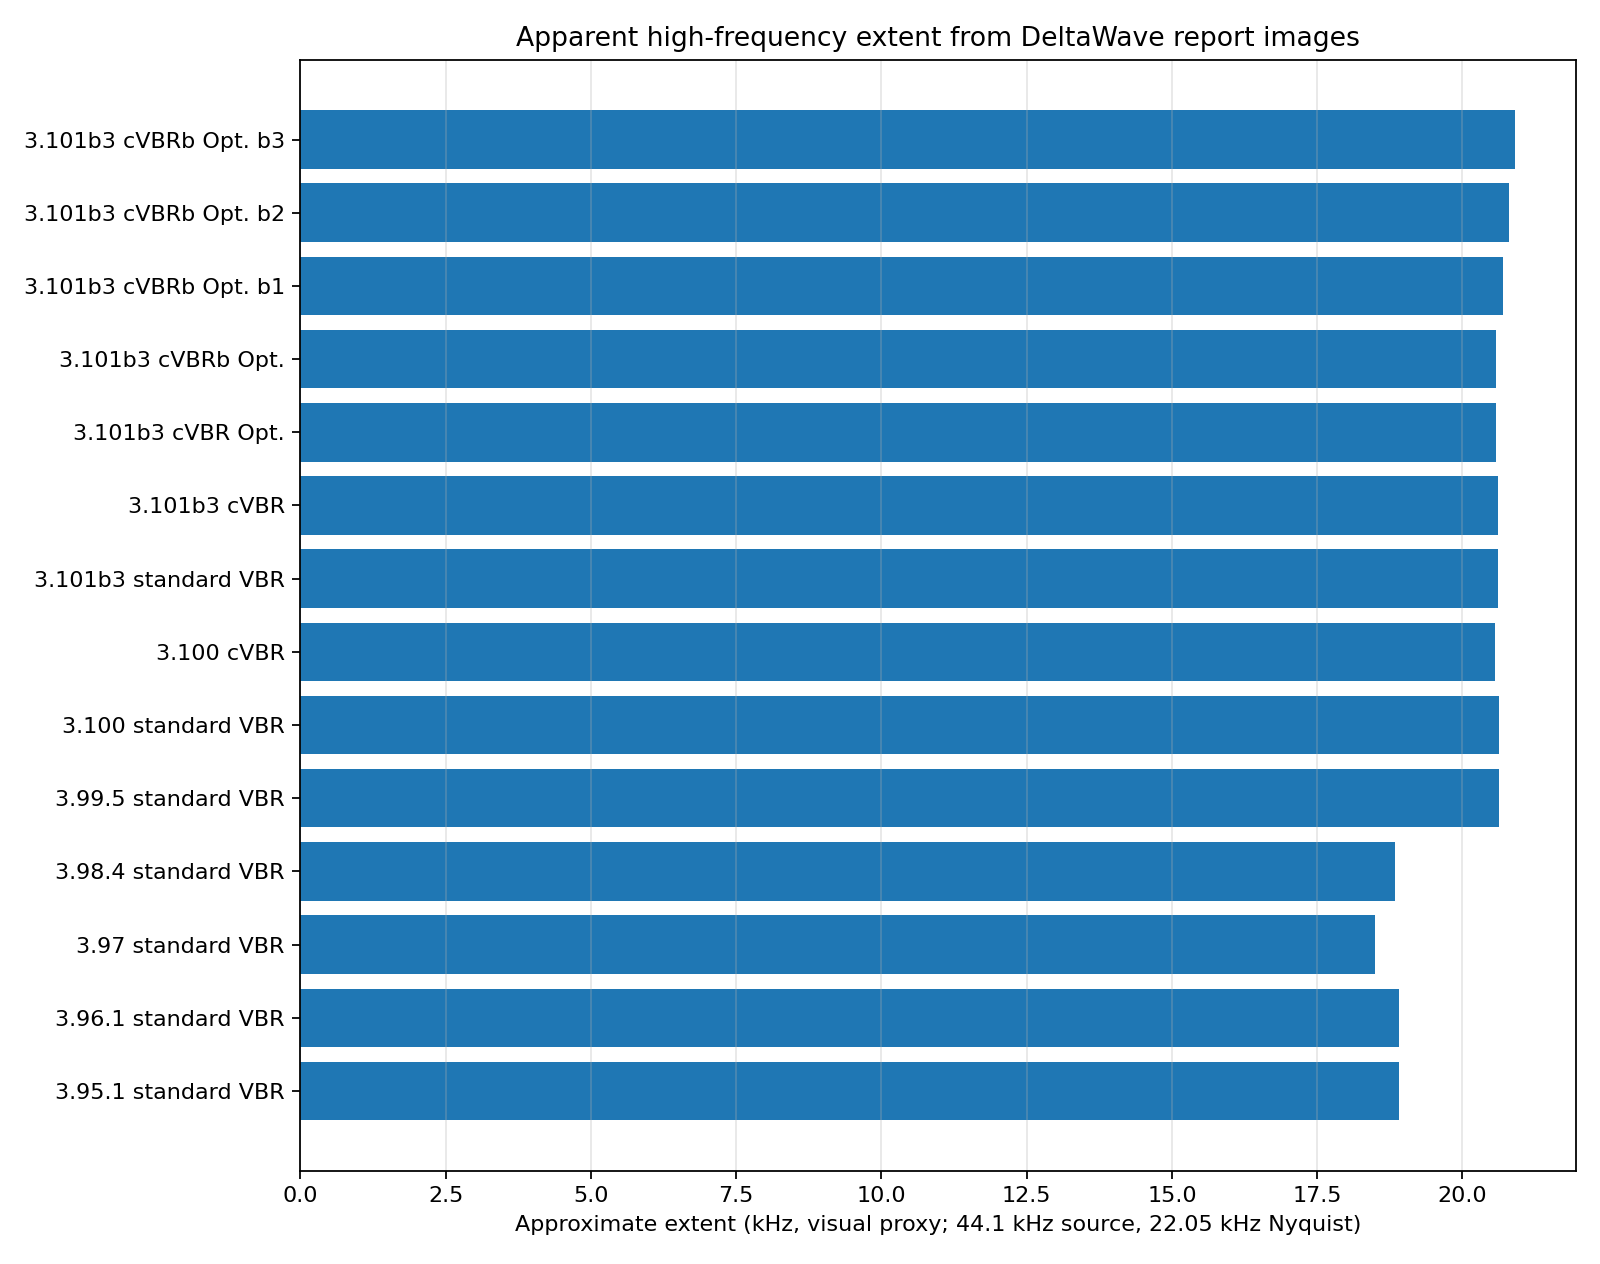
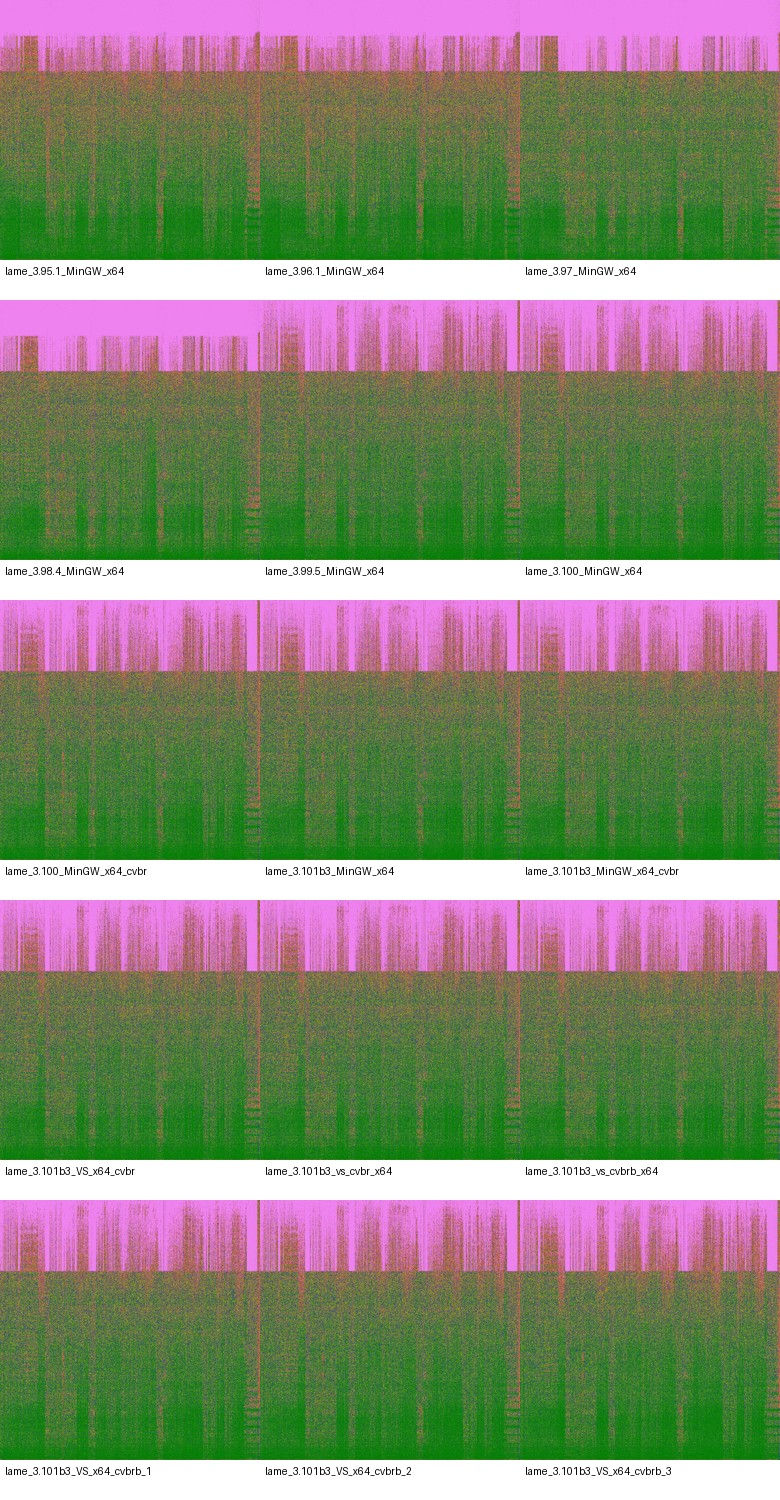
Earlier builds show visible filtering/floor behaviour in the DeltaWave images and generally lower apparent high-frequency extent.
3.99.5 and newer modern rows extend higher in this image-derived proxy, usually around the upper part of the 44.1 kHz source bandwidth.
This is not a quality verdict. A wider visible range does not automatically mean better perceived sound.
Apparent high-frequency extent
The source is 44.1 kHz, so the Nyquist limit is 22.05 kHz. These values are approximate visual estimates from the DeltaWave report images, not exported frequency-response measurements.
Approximate high-frequency extent derived from the embedded DeltaWave images. Treat this as a proxy for visible filtering/floor behaviour.
How to read it: higher kHz means the image-derived proxy found activity extending higher in frequency. It does not automatically mean better audible quality.
Frequency-range proxy table
Compile / configuration
Approx. high-frequency extent
3.95.1 standard VBR
18.91 kHz
3.96.1 standard VBR
18.91 kHz
3.97 standard VBR
18.50 kHz
3.98.4 standard VBR
18.84 kHz
3.99.5 standard VBR
20.63 kHz
3.100 standard VBR
20.63 kHz
3.100 cVBR
20.56 kHz
3.101b3 standard VBR
20.61 kHz
3.101b3 cVBR
20.61 kHz
3.101b3 cVBR Optimized
20.59 kHz
3.101b3 cVBR Optimized
20.59 kHz
3.101b3 cVBRb Optimized
20.59 kHz
3.101b3 cVBRb Optimized boost 1
20.69 kHz
3.101b3 cVBRb Optimized boost 2
20.80 kHz
3.101b3 cVBRb Optimized boost 3
20.91 kHz
Visual proxy derived from the embedded DeltaWave report image. Treat this as approximate, not as a laboratory frequency-response measurement.
Embedded report images
Embedded DeltaWave report images. Horizontal floors or high-frequency truncation can affect how residual metrics should be interpreted.
How to read it: visible horizontal floors or early high-frequency drop-offs are diagnostic clues, not standalone quality scores.
Method notes and limitations
The frequency-range values are visual proxies extracted from the embedded DeltaWave images. The algorithm looks for the first sustained row of non-background activity in the spectrogram-style image and maps that row to a frequency using the 44.1 kHz source rate. This is useful for finding visible filtering floors, but it should not be described as a precise laboratory frequency-response measurement.
For a stronger page, the next step would be to export numeric spectral data or run a repeatable FFT-based measurement on each decoded WAV. That would allow exact cutoff, roll-off, and high-frequency energy comparisons rather than image-derived estimates.
FAQ
Is this a precise frequency-response measurement?
No. The range values are an approximate visual proxy from the embedded DeltaWave report images. They are useful for spotting broad filtering and floor behaviour, but should not be treated as lab-grade response measurements.
Does a wider visible range automatically mean better sound?
No. A wider visible range is not automatically a quality verdict. The chart shows output behaviour against this reference sample, not listener preference or transparency.
Why is speed not discussed here?
Encoding speed is covered in the performance studies. This lab page keeps the focus on DeltaWave output behaviour and frequency-range observations.